Xdebug - you should use it
Xdebug is an extension for PHP, and provides a range of features to improve the PHP development experience.
This post will focus on the feature we use most often - Step Debugging as well as configuration, installation, and a bit of Magento 2.
Xdebug 2 vs 3
Xdebug 3 made a lot of great improvements over Xdebug 2. Performance is notably better across the board, and the configuration is much easier.
Notable Differences
Take a look at the performance article linked above, and the official docs on upgrading from version 2 to 3 for extra detail.
xdebug.mode
Instead of having a handful of configuration settings for each use case - most settings have been condensed into a single setting called xdebug.mode. This is an excellent addition because configurations like this:
1
2
3
4
5
xdebug.remote_enable=1
xdebug.default_enable=0
xdebug.profiler_enable=0
xdebug.auto_trace=0
xdebug.coverage_enable=0
Now look like this:
1
xdebug.mode=debug
Nice right? There are a handful of other modes as well, but we’ll most likely be using debug or off. Setting the mode to off will disable all Xdebug features, reducing its performance impact to nearly nothing.
xdebug.start_with_request
This is a really neat feature in Xdebug 3.
If we set this to yes then Xdebug is always running. A better option is to set this to trigger. Then, certain xdebug values passed with the request will trigger Xdebug to run, instead of it running all the time. start_with_request=trigger looks at xdebug.trigger_value for the trigger value. This defaults to “”, which will accept ANY value in the XDEBUG_TRIGGER header or environment variables.
Now this is a bit confusing because a lot of tutorials out there don’t follow this, and you never see XDEBUG_TRIGGER used. Why is that... Xdebug also accepts the following legacy names for their types instead of XDEBUG_TRIGGER:
1
2
3
XDEBUG_SESSION == Step Debugging
XDEBUG_PROFILE == Profiling
XDEBUG_TRACE == Function Trace
So on the CLI I still use XDEBUG_SESSION=AnyValue php MyScript.php, and in a web browser, the helper extensions generally set a XDEBUG_SESSION cookie when set to debug mode, using your IDEkey as the value.
TLDR
xdebug.remote_hostReplaced by xdebug.client_hostxdebug.remote_logReplaced by xdebug.logxdebug.remote_autostarthas been removed. xdebug.start_with_request is used instead, with the value ofyesxdebug.remote_connect_backReplaced by xdebug.discover_client_host set to true. If this fails, it will fallback to xdebug.client_hostxdebug.remote_enableReplaced by xdebug.mode set to debugxdebug.remote_portReplaced by xdebug.client_port The default port has also changed to 9003- With
xdebug.start_with_requestset totrigger- we can start a debugging session from the CLI withXDEBUG_SESSION=AnyValue php myscript.php
Example Xdebug 2 Configuration
1
2
3
4
5
6
7
8
9
10
[Xdebug]
zend_extension=/path/to/your/xdebug.so

xdebug.default_enable=1
xdebug.remote_enable=1
xdebug.remote_autostart=1
xdebug.idekey=PHPSTORM
xdebug.remote_port=9001
xdebug.remote_connect_back=1
xdebug.remote_host=localhost
Example Xdebug 3 Configuration
1
2
3
4
5
6
7
8
[Xdebug]
zend_extension=xdebug.so

xdebug.mode=debug
xdebug.start_with_request=yes # I set this to 'trigger'
xdebug.idekey=PHPSTORM

xdebug.client_port=9003 # 9003 is the new default port. This setting is optional.
Installing Xdebug 3
Installing Xdebug is pretty trivial. There are a few requirements though:
- For OSX:
- Must have PHP installed via Homebrew
- For Linux:
- Must have a package manager such as
aptoryum
- Must have a package manager such as
OSX
1
pecl install xdebug
Run php -v to confirm Xdebug is installed.
Note: I have seen OSX with Homebrew throw an error here about directories not existing when installing this way. If this happens to you, simply create those directories and try again. Normally it’s due to a symlink being expanded incorrectly - e.g.
/usr/local/Cellar/php@7.4/7.4.20/pecl/is actually a symlink.
Linux
1
sudo apt-get install php-xdebug
In some distributions you’ll need to use yum instead, and/or call out the specific PHP version like:
1
sudo apt-get install php7.4-xdebug
Run php -v to confirm Xdebug is installed.
Configuration
Whether you’re on Linux or OSX, you can find where PHP is scanning for ini files with:
1
2
3
4
5
6
7
8
9
10
php --ini

# Output Example:

Configuration File (php.ini) Path: /usr/local/etc/php/7.4
Loaded Configuration File:        /usr/local/etc/php/7.4/php.ini
Scan for additional .ini files in: /usr/local/etc/php/7.4/conf.d
/usr/local/etc/php/7.4/conf.d/error_log.ini,
/usr/local/etc/php/7.4/conf.d/ext-opcache.ini,
/usr/local/etc/php/7.4/conf.d/php-memory-limits.ini
Important: Add zend_extension=xdebug to the end of your primary php.ini file.
For the Xdebug ini, if we see an existing one in the list above- we can modify that one. Otherwise let’s create one in a directory we know is scanned. In this example we can create an ini in /usr/local/etc/php/7.4/conf.d and call it 20-xdebug.ini.
The file contents:
1
2
3
4
xdebug.mode=debug
xdebug.client_host=localhost
xdebug.start_with_request=trigger
xdebug.idekey=phpstorm
That’s it? Yea, basically. We can add more settings to this configuration if our situation requires it. Refer the the TLDR for some commonly used settings, or the official docs for more.
Restart php for your environment to grab the changes. If we’re using valet on OSX then valet restart, If we’re using Linux then most likely /etc/init.d/php-fpm restart
Run php --ini again and behold:
1
2
3
4
5
6
7
Configuration File (php.ini) Path: /usr/local/etc/php/7.4
Loaded Configuration File:        /usr/local/etc/php/7.4/php.ini
Scan for additional .ini files in: /usr/local/etc/php/7.4/conf.d
Additional .ini files parsed:      /usr/local/etc/php/7.4/conf.d/20-xdebug.ini,
/usr/local/etc/php/7.4/conf.d/error_log.ini,
/usr/local/etc/php/7.4/conf.d/ext-opcache.ini,
/usr/local/etc/php/7.4/conf.d/php-memory-limits.ini
PhpStorm Configuration
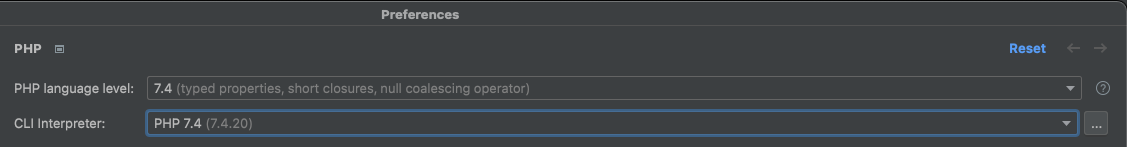
Open your preferences, and search for PHP. It will generally be under Languages & Frameworks.
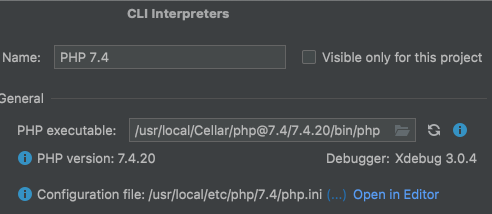
If you don’t see a CLI interpreter, click the ... beside the field and create one from your local PHP installation.
By Clicking the ... we can see if we have a debugger installed properly:
Click on Debug under the PHP menu in your preferences, Enter your xdebug.client_port value in the Debug port: field. Default is 9003 for xdebug, but this field accepts multiple values if you like- just comma separate them (9000,9003).
Check the Can accept external connections checkbox.
Checking the Force break at first line when no path mapping specified checkbox is a good idea- this will cause the debugger to stop on any files outside of your servers set in the Servers tab, while it’s running.
Checking the Force break at first line when a script is outside the project can be helpful sometimes, but will become annoying quickly if you don’t need that.
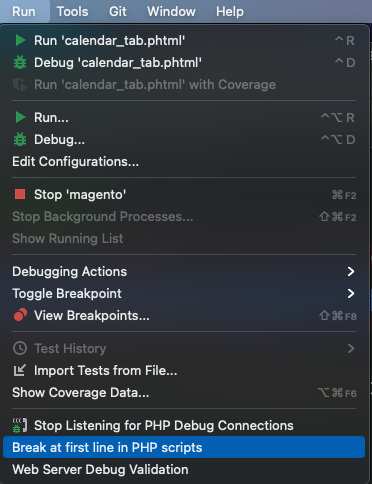
In the External Connections section - Set your max simultaneous connections, and take note of the option Break at first line in PHP scripts. This option can also be enabled via the main menu -> Run -> Break at first line in PHP scripts

Helpers
There are a TON of great helper features in Xdebug 3. Too many to cover here.
Browser Extensions
To easily trigger Xdebug via your browser, grab the helper extension for your browser of choice.
Xdebug Helper for Firefox (source). Xdebug Helper for Chrome (source). XDebugToggle for Safari (source).
Each extension adds an icon to your browser where you can select which functionality you want to trigger. Xdebug will start debugging for every request as long as the debug toggle has been enabled. The settings of the extension generally include fields for your trigger and/or IDE key values.
Using Xdebug in PhpStorm
Once configured, you can begin using your browser extension or CLI trigger in combination with toggling the debug icon: Off:  On:
On: 
Now PhpStorm is listening for Xdebug connections.
Setting breakpoints
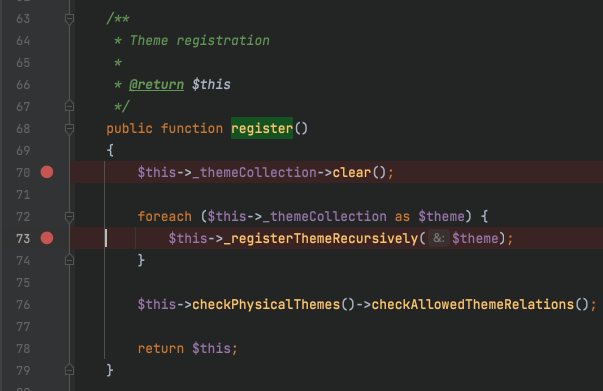
Open your desired PHP file from your project, and left click in the gutter - the red circle is your breakpoint. This is where Xdebug will pause the execution in PhpStorm, and let you take control.
You can right click the break points to enable/disable them and set conditionals - more on that in a bit.
So many buttons
So you hit a breakpoint. Now what?

It’s time to Step through the program. Your step options are 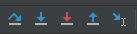
- Over(F8),
- Takes you to the next line even if the highlighted line has method calls in it.
- Into(F7),
- Follow the methods in the current line, to examine the how of what is returned.
- Force Into(Option+SHFT+F7),
- Steps into the method even if it’s skipped by the reular Step Into. I have never used this.
- Out(SHFT+F8),
- Go back to the method that called where you are now.
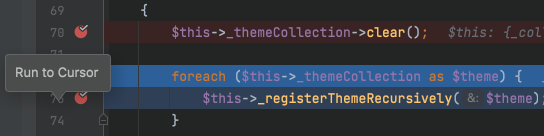
- Run to Cursor(Option+F9 or click number in gutter)
- Big time saver here. You can skip ahead during your debug session this way.
Break on script start
Don’t forget about
Run->Break at first line in PHP scripts. This option will help when you can’t find the correct files to set break points on.
Contitional Break Points
This is a very awesome feature. We can set up break points to only break when a certain value is passed through. This saves us a lot of time when we are debugging loops. To continue with the above code examples, this is the Magento 2 Theme regestration when you run setup:upgrade, and I’ve set it to only break when the Luma theme is passing by:

Evaluate Expression
In a similar and often more useful way than conditional break points, we can evaluate code on the fly.
Once a break point is triggered, we can right click anywhere in the code and select Evaluate Expression or press Option+F8

From here we can test out methods in real time, and even see suggested methods based on where we are in the code!


Conclusion
Xdebug 3 is great; Not that hard to install or configure, and you should be using it if you work with PHP. I do not miss var_dump().
Comments powered by Disqus.